
U.S. LNG exports soar
Written by Nick Blenkey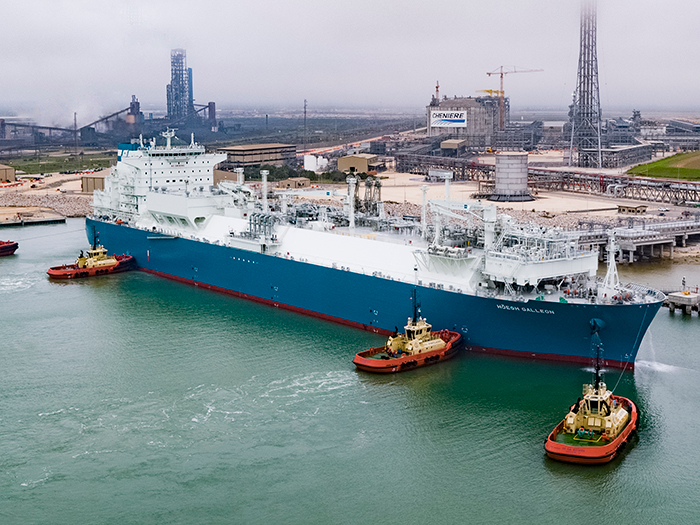
LNG carrier loading at Cheniere U.S. LNG export terminal
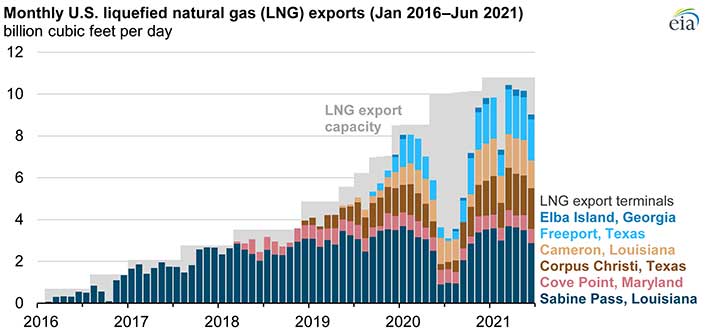
Figures released yesterday by the U.S. Energy Information Administration (EIA) show that monthly U.S. liquefied natural gas (LNG) exports reached record highs in the first half of 2021, averaging 9.6 billion cubic feet per day (Bcf/d). This average marks an increase of 42%, or 2.8 Bcf/d, compared with the same period in 2020 (according to the U.S. Department of Energy’s LNG Monthly reports and EIA estimates for June 2021, based on shipping data from Bloomberg Finance L.P.).
During the summer months of 2020, U.S. LNG exports fell to record lows, but they set consecutive record highs in November and December. U.S. LNG exports increased as international natural gas and LNG spot prices increased in Asia and Europe due to cold weather. Rising global LNG demand once COVID-19 restrictions began to ease, as well as continuous unplanned outages at LNG export facilities in several countries (including Australia, Malaysia, Nigeria, Algeria, Norway, and Trinidad and Tobago), also contributed to increased U.S. LNG exports.
In Asia, colder-than-normal winter temperatures led to increased demand for spot LNG imports. Natural gas demand in the spring continued to rise amid low post-winter inventories, which contributed to unseasonably high natural gas prices. The high prices prompted a higher demand for more flexible LNG supplies, particularly from the United States.
In Europe, natural gas storage inventories were also low following a cold winter. Increasingly hot temperatures in May and June and greater natural gas demand from the electric power sector contributed to high natural gas spot prices. Europe’s natural gas spot prices have historically been lower than prices in Asia; however, this year, says the EIA, Europe’s natural gas prices are tracking Asia’s spot LNG prices more closely to attract flexible LNG supplies from around the world to refill storage inventories.
The U.S. Henry Hub natural gas benchmark and U.S. LNG spot market prices have been lower than prices for international natural gas and spot LNG this year. This price difference has supported record volumes of U.S. LNG exports. U.S.
LNG exports also increased because of new export capacity added in 2020. The final liquefaction units were commissioned at Freeport, Cameron, and Corpus Christi LNG, and the remaining small-scale units were placed in service at Elba Island LNG. The new units increased total U.S. LNG export capacity by a combined 2.7 Bcf/d for a total peak capacity of 10.8 Bcf/d.
As in 2020, Asia remained the top destination for U.S. LNG exports from January through May in 2021, accounting for 46% of the total. Asia was followed by Europe, which had a five-month average share of 37%. Exports to Latin America also increased, particularly to Brazil, which is experiencing its worst drought in more than 90 years.
In June, U.S. LNG exports declined slightly, mainly as a result of maintenance on several pipelines that deliver natural gas to U.S. LNG export facilities. However, in its Short-Term Energy Outlook, EIA expects LNG exports to remain at high levels in the remaining months of this year.
Categories: Engines & Fuel, Markets, News, Shipping

![ME-LGIA ammonia engine TAT will be the final one at the RCC in Copenhagen before its location is moved outside the city in late-2027. [Photo: Everllence]](https://www.marinelog.com/wp-content/uploads/2026/06/everllence_fat_thumbnail41f9bf402cda41359043ac75c2242b9c-300x225.jpg)