Hornbeck Offshore reports strong fourth quarter
Written by Nick Blenkey Covington, La., headquarted Hornbeck Offshore Services, Inc. (NYSE: HOS) announced results for the fourth quarter ended December 31, 2011 that included soaring revenues, operating income and net income. The strong quarter, however, was not enough to offset the damage done by the administration’s drilling ban earlier in the year and, for the full year, the company recorded a net loss of $2.6 million, compared to net income of $36.4 million for 2010.
Fourth quarter 2011 revenues increased 26.1 percent to $122.7 million compared to $97.3 million for the fourth quarter of 2010 and increased 16.0 percent compared to $105.8 million for the third quarter of 2011. Operating income was $35.8 million, or 29.2 percent of revenues, for the fourth quarter of 2011 compared to $18.7 million, or 19.2 percent of revenues, for the prior-year quarter; and $14.6 million, or 13.8 percent of revenues, for the third quarter of 2011. Net income for the fourth quarter was $14.2 million, or $0.45 per diluted share, compared to net income of $2.6 million, or $0.10 per diluted share, for the year-ago quarter; and a net loss of $0.7 million , or ($0.03) per diluted share, for the third quarter of 2011.
Diluted common shares for the fourth quarter of 2011 were 31.8 million compared to 27.2 million for the fourth quarter of 2010 and 26.9 million for the third quarter of 2011. Fourth quarter 2011 EBITDA increased 45.8 percent to $56.7 million compared to $38.9 million for the fourth quarter of 2010 and increased 62.0 percent compared to $35.0 million for the third quarter of 2011.
Hornbeck Offshore reports that it incurred $1.8 million and $6.5 million of mobilization and prepositioning costs during the fourth quarter of 2011 and third quarter of 2011, respectively, related to mobilizing vessels to foreign markets. Excluding these pre-positioning costs for both periods for the sake of comparability, the Company’s adjusted fourth quarter 2011 EBITDA, operating margin and diluted earnings per share would have been $58.5 million, 30.6 percent and $0.49 compared to $41.5 million, 20.0 percent and $0.10 for the third quarter of 2011, respectively.
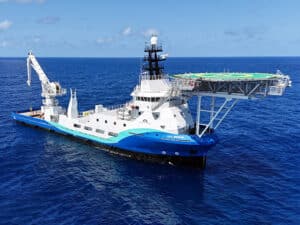
Upstream Segment. Revenues from the Upstream segment were $109.6 million for the fourth quarter of 2011, an increase of $24.2 million, or 28.3 percent, from $85.4 million for the fourth quarter of 2010; and an increase of $17.6 million, or 19.1 percent, from $92.0 million for the third quarter of 2011. Higher Upstream revenues for the fourth quarter of 2011 compared to the same period in 2010 primarily resulted from an increase in demand for the company’s MPSVs, the re-activation of vessels that were stacked during the prior year, and incremental vessels operating in Latin America. Upstream operating income was $35.3 million, or 32.2 percent of revenues, for the fourth quarter of 2011 compared to $17.7 million, or 20.7 percent of revenues, for the prior-year quarter; and $13.8 million, or 15.0 percent of revenues, for the third quarter of 2011. Average new generation OSV dayrates for the fourth quarter of 2011 were $21,863 compared to $20,694 for the same period in 2010 and $20,945 for the third quarter of 2011. New generation OSV utilization was 83.5 percent for the fourth quarter of 2011 compared to 66.3 percent for the year-ago quarter and 75.3 percent for the sequential quarter. The primary drivers for the sequential increase in Upstream revenues and operating income were higher demand for the company’s MPSVs, a full-quarter contribution from four vessels that commenced long-term contracts in Brazil during the third quarter of 2011 and, to a lesser extent, improved spot market conditions in the GoM due to a substantial increase in deepwater drilling permits being issued in September and October 2011. The company had an average of 5.2 stacked new generation OSVs during the fourth quarter of 2011 compared to quarterly averages of 9.4 stacked vessels during the year-ago quarter and 6.3 stacked vessels during the sequential quarter. Effective new generation OSV utilization for the Company’s active fleet, which excludes the impact of stacked vessels, was 93.0 percent for the fourth quarter of 2011 compared to 81.3 percent for the year-ago quarter and 85.9 percent for the sequential quarter.
Downstream Segment. Revenues from the Downstream segment of $13.1 million for the fourth quarter of 2011 increased by $1.2 million, or 10.1 percent, compared to $11.9 million for the same period in 2010, and were lower than the sequential quarter by $0.8 million, or 5.8 percent. The year-over-year revenue increase was largely due to improved market conditions in the Northeast and in the GoM along with fewer days out-of-service for regulatory drydocking, partially offset by a decline in revenues related to oil spill response activities, which concluded in late-December 2010. The company’s double-hulled tank barge average dayrates were $18,176 for the fourth quarter of 2011 compared to $16,782 for the same period in 2010 and $18,222 for the sequential quarter. Tank barge dayrates for the current-year quarter were favorably impacted by well-test services performed for an Upstream customer. Utilization for the double-hulled tank barge fleet was 87.3 percent for the fourth quarter of 2011 compared to 85.6 percent for the year-ago quarter and 92.0 percent for the sequential quarter. Effective, or utilization-adjusted, dayrates for the company’s double-hulled tank barges were $15,868 for the fourth quarter of 2011, which is $1,503, or 10.5 percent, higher than the prior-year quarter effective dayrates. The sequential decreases in Downstream revenues, dayrates and utilization are largely due to soft market conditions for the Company’s barges servicing the black oil market in the GoM.
Annual 2011 Results
Revenues for 2011 decreased 9.3 percent to $381.6 million compared to $420.8 million for 2010. Operating income was $55.0 million, or 14.4 percent of revenues, for 2011 compared to $112.2 million, or 26.7 percent of revenues, for the prior year. Net income for 2011 decreased $39.0 million to a net loss of ($2.6 million), or ($0.09) per diluted share, compared to net income of $36.4 million, or $1.34 per diluted share, for 2010. The year-over-year decrease in revenues, operating income and net income was primarily due to regulatory-driven demand weakness in the GoM, which contributed to a reduction in drilling activity in the GoM. This led to a significant decline in MPSV utilization and the Company’s decision to stack an average of 9.2 new generation OSVs during 2011. However, with the re-activation of the 220 class HOS Explorer in October 2011 and the HOS Express in January 2012, the company now has four DP-1 new generation OSVs stacked, all of which are expected to be re-activated for service in the GoM during the first half of 2012, provided that the Company is able to re-crew such vessels and complete any required drydocking activities. The year-over-year decrease in Upstream revenues was partially offset by the incremental revenue contribution from vessels operating in Latin America. The Company’s net income for 2011 included a $1.5 million ($1.1 million after-tax, or $0.04 per diluted share) gain on the sales of the Company’s last four remaining single-hulled tank barges and two ROVs for net cash proceeds of $11.3 million. The Company’s net income for 2010 included a $1.9 million ($1.2 million after-tax or $0.04 per diluted share) gain on the sale of two conventional OSVs and one older, lower-horsepower tug, and two single-hulled tank barges for net cash proceeds of $4.5 million.
Forward Guidance
Vessel Counts. As of December 31, 2011, excluding seven non-core vessels, the company’s operating fleet consisted of 51 new generation OSVs, four MPSVs, nine double-hulled tank barges and nine ocean-going tugs. The active Upstream Fleet for fiscal 2012 is expected to be comprised of an average of 49.5 new generation OSVs and four MPSVs. These active new generation OSVs are comprised of an average of 27.0 “term” vessels that are currently chartered on long-term contracts and an average of 22.5 “spot” vessels that are currently operating or being offered for service under short-term charters. The active Downstream fleet for 2012 is expected to consist of nine double-hulled tank barges and nine-ocean going tugs.
Contract Coverage. Hornbeck Offshore’s forward contract coverage for its 51-vessel fleet of new generation OSVs for the fiscal years ending 2012 and 2013 is currently 59 percent and 27 percent, respectively. Forward contract coverage for the company’s four MPSVs for the fiscal years ending 2012 and 2013 is currently 69 percent and 40 percent, respectively. Forward contract coverage for the nine-vessel fleet of double-hulled tank barges for the fiscal year ending 2012 is currently 20 percent. These contract backlog percentages are based on available vessel-days for the guidance periods, not estimated revenue.
Effective Dayrates. Effective, or utilization-adjusted, new generation OSV dayrates for the company’s projected average of 27.0 active “term” OSVs are expected to be in the $19,000 to $20,000 range for the full-year 2012. This range does not reflect the incremental impact of any revenue expected to be derived in fiscal 2012 from the company’s average 22.5 “spot” OSVs and average 1.5 “stacked” OSVs. The Company does not provide annual guidance regarding the effective dayrates anticipated for the average 24.0 “non-term” new generation OSVs due to the wide range of potential outcomes of its current domestic and international bidding activity for such vessels. Hornbeck says recently improved market conditions have allowed it to achieve leading-edge spot dayrates for its 240 class DP-2 OSVs in the $28,000 to $30,000 range, or roughly double the spot dayrate levels from the first half of 2011. Whether these rates can be sustained will depend on the future pace of permitting in the GoM. Effective dayrates for the company’s nine double-hulled tank barges are projected to be in the range of $14,000 to $15,000 for the full-year 2012.
Operating Expenses. Aggregate cash operating expenses for the Upstream segment are projected to be in the range of $200 million to $210 million for 2012. However, this cash operating expense estimate is exclusive of any additional repositioning expenses the company may incur that are not recoverable through charter hire in connection with the potential relocation of more of its current spot and/or stacked vessels into international markets or back to the GoM; or any customer-required cost-of-sales related to future contract fixtures that are typically recovered through higher dayrates. Aggregate cash operating expenses for the company’s Downstream segment are projected to be in the range of $30 million to $32 million for 2012. After excluding approximately $9.5 million of mobilization costs incurred during 2011, consolidated operating expenses for 2012 are expected to be roughly 20 percent higher than 2011 due to (i) a previously reported $500 per-day anticipated increase in cash operating expenses for vessels that will be in service for all of 2011 and 2012 (“same-store-sales basis”); (ii) the re-activation during 2012 of an average of 7.7 new generation OSVs that were previously stacked; and (iii) the addition of an average of 2.0 vessels to the Company’s Upstream fleet operating in Brazil, where cash operating expenses are generally double the levels for comparable vessels operating the GoM.
Newbuilding Program: Hornbeck Offshore expects to own and operate 51, 56 and 67 new generation OSVs as of December 31, 2012, 2013 and 2014, respectively. Vessel additions result in a projected average new generation OSV fleet complement of 51.0, 52.2 and 62.8 vessels for the fiscal years 2012, 2013 and 2014, respectively. The aggregate cost of the company’s fifth OSV newbuild program, excluding construction period interest, is expected to be approximately $720.0 million, of which $242.9 million, $347.7 million and $87.0 million is expected to be incurred in 2012, 2013 and 2014, respectively. From the inception of this program through December 31, 2011, the company has incurred $42.4 million, or 5.9 percent, of total expected project costs.
Liquidity Outlook
As of December 31, 2011, the company had a cash balance of $356.8 million and an undrawn $300 million revolving credit facility. The company expects to generate sufficient cash flow from operations to cover all of its cash debt service, annually recurring maintenance capital expenditures and cash income taxes, which are expected to be in the $100 million to $110 million range, in the aggregate, for the full-year 2012. It does not anticipate a need to draw on its revolving credit facility at any time during 2012 or for the foreseeable future, absent any future growth opportunities that may arise.
Categories: Oil & Gas


Leave a Reply
You must be logged in to post a comment.