![The 52-foot Mirage is the third flagship platform in Saronic’s growing ASV fleet. [Photo: Saronic Technologies]](https://www.marinelog.com/wp-content/uploads/2026/07/smirage-300x225.jpg)
Cruise industry continues to grow
Written by Nick Blenkey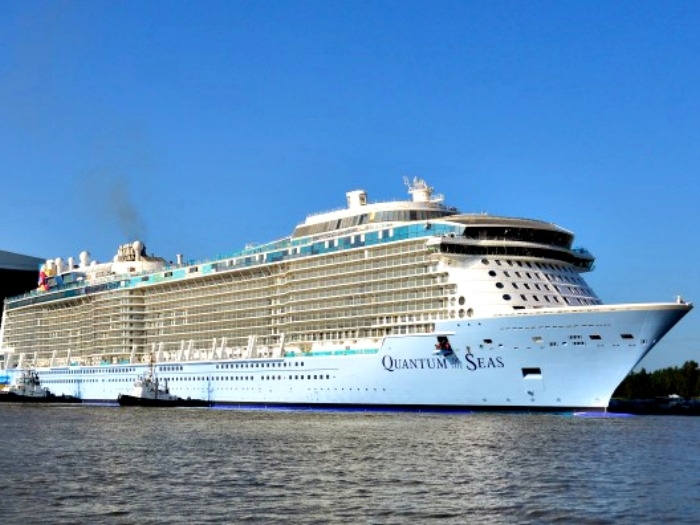
Ships set to soon join the fleet include the Quantum of the Seas
SEPTEMBER 15, 2014 — Since 2010, the year the U.S. economy began its recovery from the 2009 recession, the North American cruise industry has experienced significant growth in its capacity and in the number of passengers embarking from U.S. ports, according to a report by Business Research and Economic Advisers (BREA).
The industry also continues to generate a significant number of U.S. jobs.
Commissioned by the Cruise Lines International Association (CLIA), the report is entitled The Contribution of the North American Cruise Industry to the U.S. Economy in 2013.
It found that:
- Over the three year period since 2010, the industry has seen the number of ocean-going ships in its worldwide fleet increase by 5.3 percent, to 178 vessels. With increasingly larger cruise ships being introduced, the lower berth capacity of the fleet has increased by 10 percent while available bed days have increased by 18 percent.
- After a strong rebound in 2010 and 2011 from the recession induced impacts of 2009, the North American cruise industry continued to expand in 2012 and again into 2013. In both 2010 and 2011 global passenger carryings and available bed days increased by approximately 10 percent. This increase allowed the industry to reach new highs for capacity and passenger carryings.
- The growth in available bed days has continued, rising 5.5 percent in 2012, and another 2.7 percent in 2013. Similarly, global passenger carryings continued to increase, by 3.8 percent in 2012 and by 3.9 percent during 2013.
A number of factors influenced the level of growth in 2013 including: i) weak economic conditions in Europe which reduced demand for cruises, especially in the Mediterranean; ii) the continued weak growth in consumer discretionary spending in the United States; and iii) continued redeployment of capacity from the North American markets to other regions, such as Asia, Australia and the South Pacific.
During 2013, there was a net increase of one ship bringing the fleet of the CLIA member ocean going cruise lines to 178 ships with 338,505 lower berths, a 2.8 percent increase in capacity. The moderation in capacity growth during 2013 was primarily the result of the re-movals of larger ships, most notably the Carnival Destiny (2,624 pax) and Royal Caribbean’s Monarch of the Seas (1,978). The introduction of the Norwegian Breakaway added 3,970 lower berths. Other vessels introduced during 2013 included: the Carnival Sunshine (2,992 pax), Costa neoRiviera (1,248), Royal Princess (3,600), MSC’s Preziosa (3,500) and the Silver Galapagos (100 pax).
The net increase in ships and lower berths resulted in a 2.7 percent increase in the number of available bed days in 2013. With a net increase of one cruise ship and the addition of over 9,000 lower berths, the average size of a vessel rose from 1,860 lower berths to just over 1,900.
The regional deployment of the industry’s capacity (available bed days) continued to shift to three principal markets, Asia, Australia/Pacific and South America. Combined these three markets experienced a 20 percent increase in capacity and accounted for more than half of the global increase in bed day capacity during 2013. At the same time Europe’s growth con-tinued, though at a slower pace, from 18 percent in 2011 to 6.7 percent in 2012 and to 3.5 percent in 2013.
North America remains the largest market in terms of deployed capacity, accounting for about 40 percent of the industry’s available bed days.
Growth in passenger carryings continued in 2013, rising 3.9 percent. As a result, global passengers of CLIA member ocean going cruise lines reached a new high of 17.6 million.
In fact since 2010 passenger carryings have increased by 18.8 percent.
This increase was primarily the result of the increase in capacity and a capacity utilization rate which rose from 102.2 percent in 2011 to 104.7 percent in 2013.
With the average length of a cruise and capacity utilization increasing, purchased global passenger bed days increased at a faster rate than passenger carryings in 2013, 4.8 percent versus 3.9 percent. Since 2010, purchased passenger bed days have increased by 20 percent.
While cruise passenger embarkations at U.S. ports declined slightly in 2013 to 9.96 million , they remained 3 percent higher than in 2010. This minor decline in U.S. embarkations during 2013 is the result of two primary causes. First, the cruise industry has been focused on increasing its deployed capacity in new markets, first Europe and now in Asia and the Australia / Pacific markets. Second, deployed capacity has been contracting in the Caribbean, and most recently Mexico.
Passengers sourced from the U.S., including Puerto Rico, reached 10.7 million in 2013. This is another high and now stands 6 percent higher than in 2010. As a result, cruise passengers sourced from the United States accounted for 61 percent of all passengers carried by the North American cruise lines.
The growth in spending by the industry and its passengers and crew in the United States rose by 2.4 percent to $20.1 billion in 2013, 11.6 percent higher than in 2010. With this increase in cruise industry spending in the U.S., total spending reached a new peak of $20 billion. The $16.5 billion in expenditures by the cruise lines for wages, taxes and goods and services accounted for 82 percent of the direct spending and was a 3.1 percent increase from 2012.
Cruise lines’ direct expenditures for goods and services (including capital equipment) also increased by 3.1 percent while payments for wages and taxes made by the cruise lines in the United States rose by 3.2 percent; $3.63 billion in passenger and crew spending for transportation, accommodations, food and other retail goods accounted for the remaining 18 percent.
Since 2010, passenger and crew spending has increased by 6.5 percent.
The major characteristics of the North American cruise industry’s activity during 2013 are as follows:
- By year-end 2013, the cruise industry’s ocean-going fleet showed a net increase of one, to 178 ships with a combined capacity of 338,505 lower berths. Since 2010, the number of ships in the North American fleet has increased by 5.3 percent while the number of lower berths have increased by 10 percent.
- During 2013, the North American cruise industry carried 17.6 million passengers on a global basis. This represented a 3.9 percent increase from the previous year and a 18.8 percent increase over 2010.
- An estimated 10.7 million U.S. residents took cruise vacations throughout the world and accounted for 61 percent of the industry’s global passengers.
- An estimated 9.96 million cruise passengers embarked on their cruises at U.S. ports during 2013, accounting for 57 percent of the North American cruise industry’s global embarkations. Florida, whose ports handled 6.15 million embarkations, accounted for 62 percent of all U.S. cruise embarkations, an increase of two percentage points from 2012.
- The cruise lines and their passengers and crew directly spent $20.1 billion on goods and services in the United States, a 2.4 percent increase from 2012 and an 11.6 percent increase from 2010. The cruise lines spent nearly $16.5 billion while passengers and crew spent slightly more than $3.6 billion.
- Including the indirect economic impacts, the spending of the cruise lines and their crew and passengers was responsible for the generation of over 363,133 American jobs throughout the country. This represents a 2 percent increase over 2012.
- Total wages and salaries paid to these workers was $18.3 billion, an increase of 5 percent over 2012.
- The cruise industry generated the direct employment of an estimated 147,898 workers with U.S. businesses, who, in return, received $6.6 billion in wages and salaries during 2013.
- Including the indirect economic impacts, the spending of the cruise lines and their crew and passengers was responsible for the generation of $44 billion in gross output in the United States, a 4.3 percent increase from 2012.
- Within the U.S., cruise industry expenditures were up from $10.67 million in 2012 to $10.71 in 2013.
- Nearly 70 percent of the cruise industry’s non-wage expenditures were made with U.S.-based businesses.
Categories: News
![USNS William Mclean (T-AKE 12). [U.S. Navy photograph]](https://www.marinelog.com/wp-content/uploads/2026/07/TAKE-12-300x225.jpg)

![Going forward, all operations of the combined operation will be conducted under the Moran Towing Corporation name. [Photo: Moran Towing]](https://www.marinelog.com/wp-content/uploads/2026/07/MichaelS-300x250.jpg)

Leave a Reply
You must be logged in to post a comment.