St. Louis metro ports stay at the top in tons per river mile stats
Written by Marine Log Staff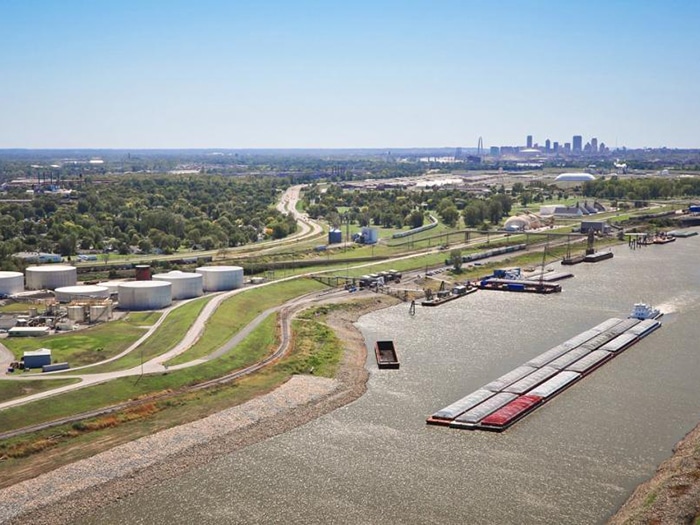
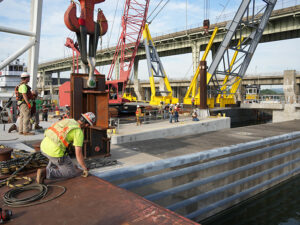
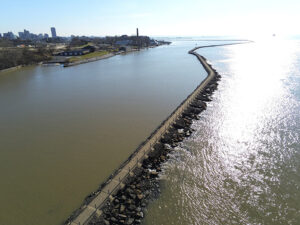
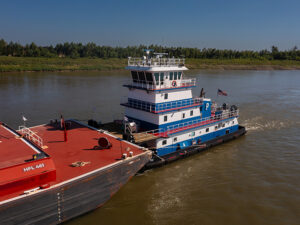
Image: St. Louis Regional Freightway.
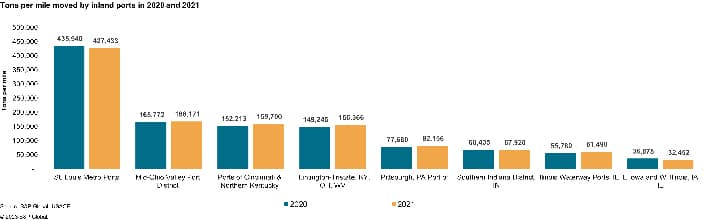
The St. Louis Regional Freightway says that an an independent report by S&P Global Commodity Insights analyzing U.S. Army Corps of Engineers (USACE) data reveals that, collectively, the ports in the St. Louis metropolitan area remain the most efficient inland port district in the U.S. in terms of tons moved per river mile. Essentially, the St. Louis metro ports moved more than four times the average tons per mile, as compared to the other seven inland port districts in the U.S.
According to the Freightway, the analysis revealed that, in 2021, the most recent year for which numbers are available. the St. Louis region’s barge industry handled 427,000 tons per mile, while the average tons per mile across the other seven inland port districts was 104,014.
St. Louis metro ports include the following individual ports, with the first three handling more than 80% of the total tonnage moved in 2021: America’s Central Port (Ill.), Southwest Regional Port District (Ill.), St. Louis City Port Authority (Mo.), St. Louis County Port Authority (Mo.) and Jefferson County Port Authority (Mo.).
Collectively serving 70 miles along the Mississippi River, the five ports handled nearly 30 million tons of cargo in 2021, on par with the prior year’s 30.5 million tons. With that tonnage total, the St. Louis Metro Port system also remains one of the highest tonnage inland ports nationwide, ranking number four.
While St. Louis metro ports did not undergo any boundary changes in the past 10 years, the S&P Global Commodity Insights report calls attention to some major inland ports that were reclassified by the USACE, impacting their latest statistics. The data reveals that new ports breaking into the top rankings were the result of a recent reclassification of two port districts (Southern Indiana District and the Mid-Ohio Valley District). These reclassifications led to changes in the statistical boundaries of these ports and subsequently larger reported tonnage for these districts by covering statistical “gap areas” (in the case of Mid-Ohio) and aggregating ports that were previously reported separately (in the case of the Southern Indiana District).
Even though the reclassification took the Mid-Ohio Valley Port District into the top spot for total tonnage, with 36.5 million tons of cargo moved in 2021, this port area now encompassing approximately 217 total water miles of the Ohio River only moved 168,000 tons per river mile, 60% fewer tons per river mile than the St. Louis Port system.
Rounding out the top five inland ports for tonnage are the Ports of Cincinnati & Northern Kentucky, encompassing approximately 225 miles (No. 2 with total tonnage of 36 million), Huntington-Tristate, Ky, Ohio, W.Va., encompassing approximately 199 miles (No.3 with total tonnage just over 31 million) and the newly reclassified Southern Indiana Port District, encompassing approximately 356 miles (No. 5 with total tonnage just over 24 million). Due to their larger size, the tons moved per river mile at each of these ports also ranks well below the St. Louis metro ports. Though not part of St. Louis metro ports by the definition of the U.S. Army Corps of Engineers, the Kaskaskia Regional Port District is an additional port in the bi-state St. Louis region that also plays an important role in moving freight on the inland waterways. It has consistently handled over five million tons of cargo annually since 2017.
A LEADER IN THE AGRICULTURE INDUSTRY
As previously reported by the Freightway, currently, 50% of U.S. crops and livestock are produced within a 500-mile radius of the St. Louis region, including approximately 80% of corn and soybean acreage. The S&P Global Commodity Insights report shows that, from 2017 through 2021, St. Louis metro ports handled 25% of all corn and 28% of all soybean shipments through seven key inland ports in the Midwest.
“These are significant volumes supported by more than 200 barge handling terminals in the port district,” said Mary Lamie, executive vice president of multimodal enterprises for bi-state development and head of the St. Louis Regional Freightway. She added that a 15- mile stretch of St. Louis’ port system, known as the Ag Coast of America, is home to 16 barge-transfer facilities that, at total capacity, can handle more than 150 barges a day – the highest level of capacity anywhere along the Mississippi River.
A DIVERSIFIED SYSTEM
In addition to their importance to agriculture, handling a total of 14.45 million tons in inbound and outbound agriculture shipments in 2021, St. Louis metro ports handle large volumes of other diverse products. In 2021, St. Louis metro ports moved more than one million tons each of 10 different products, including agricultural products, sand and gravel, crude petroleum, cement and concrete, petroleum coke, asphalt, tar and pitch, and coal and lignite. With 15 million tons of non-agriculture products moving through the region’s ports, the system’s resiliency is further enhanced. St. Louis metro ports moved over one million tons each of 10 different products in 2021
“Continuing public and private investments in the St. Louis region’s ports and river terminals, and the associated freight network that serves them, have created a very competitive shipper and carrier market featuring unmatched efficiencies and lower costs,” said Lamie. “We are committed to working with the public and private sector to continue to advance the region’s highest priority projects, including improving at-grade rail crossings and increasing efficiency of freight rail interconnectivity with the region’s Class I railroads, as that is key to supporting the barge industry and is critical for maintaining global competitiveness.”
Categories: Inland, News, Ports & Terminals